
Project information
- Category: Data Analysis
- Technology: Tableau,SQL,Excel,Flask,Bootstrap,Kaggle.
- Project date: 01 May, 2023
- Project URL: https://rajat2308.github.io/IPL-Statistics/
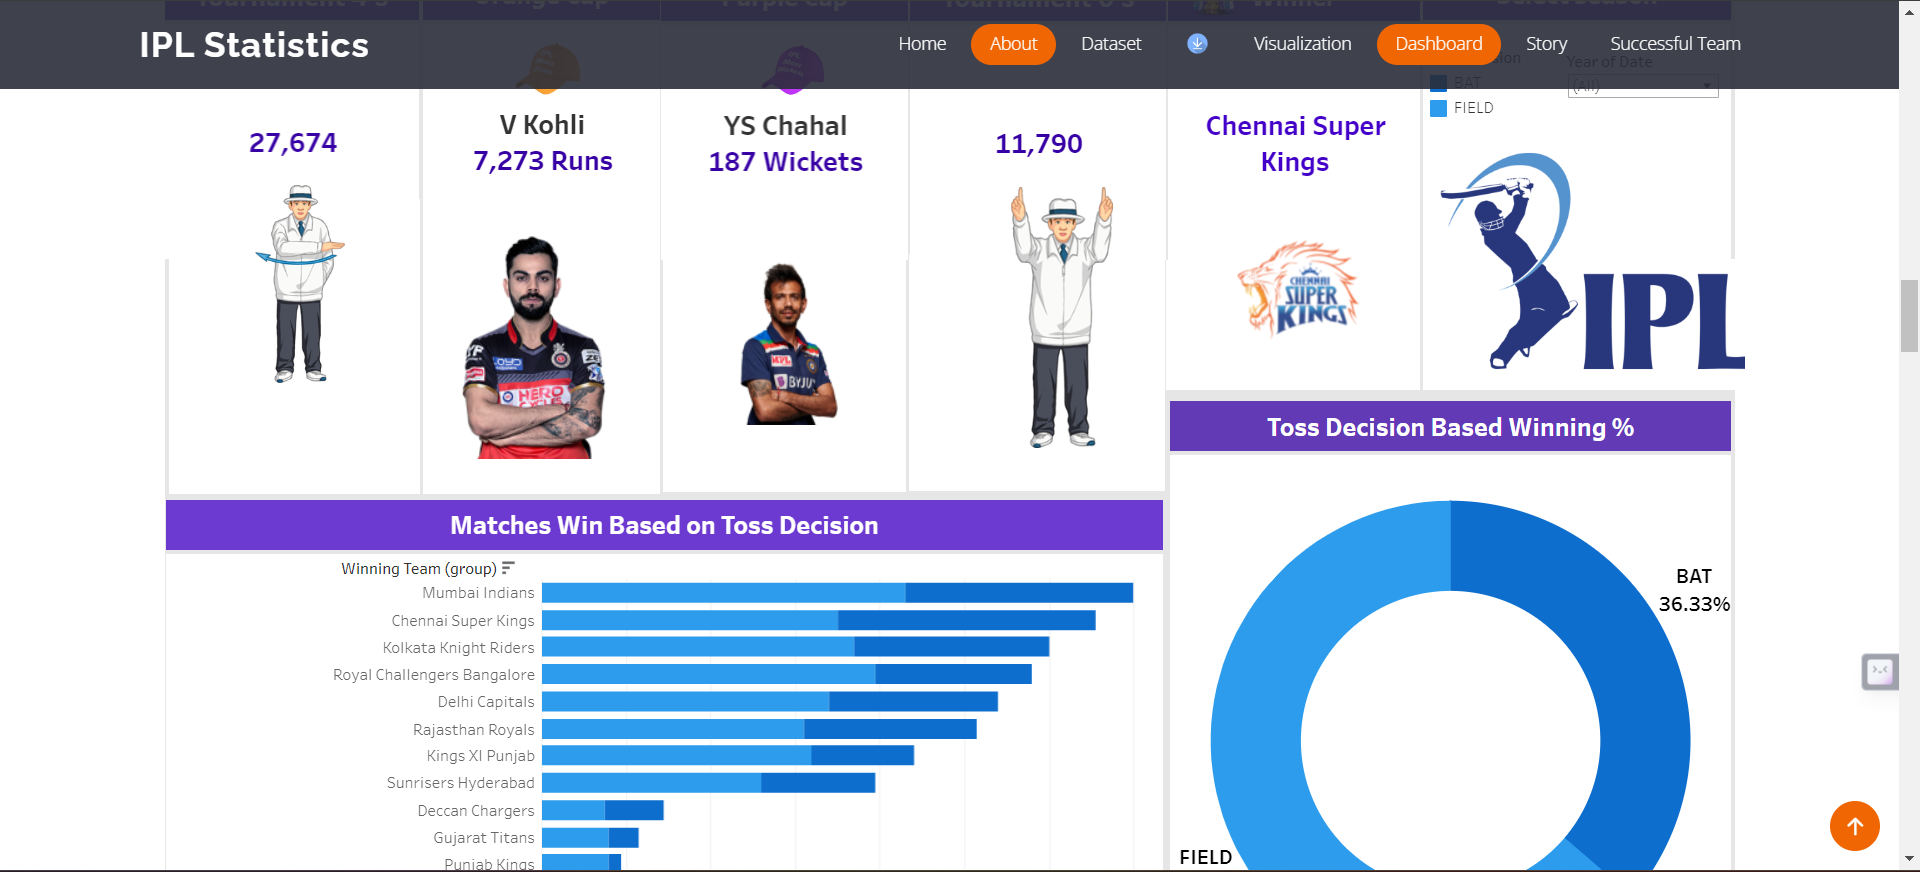
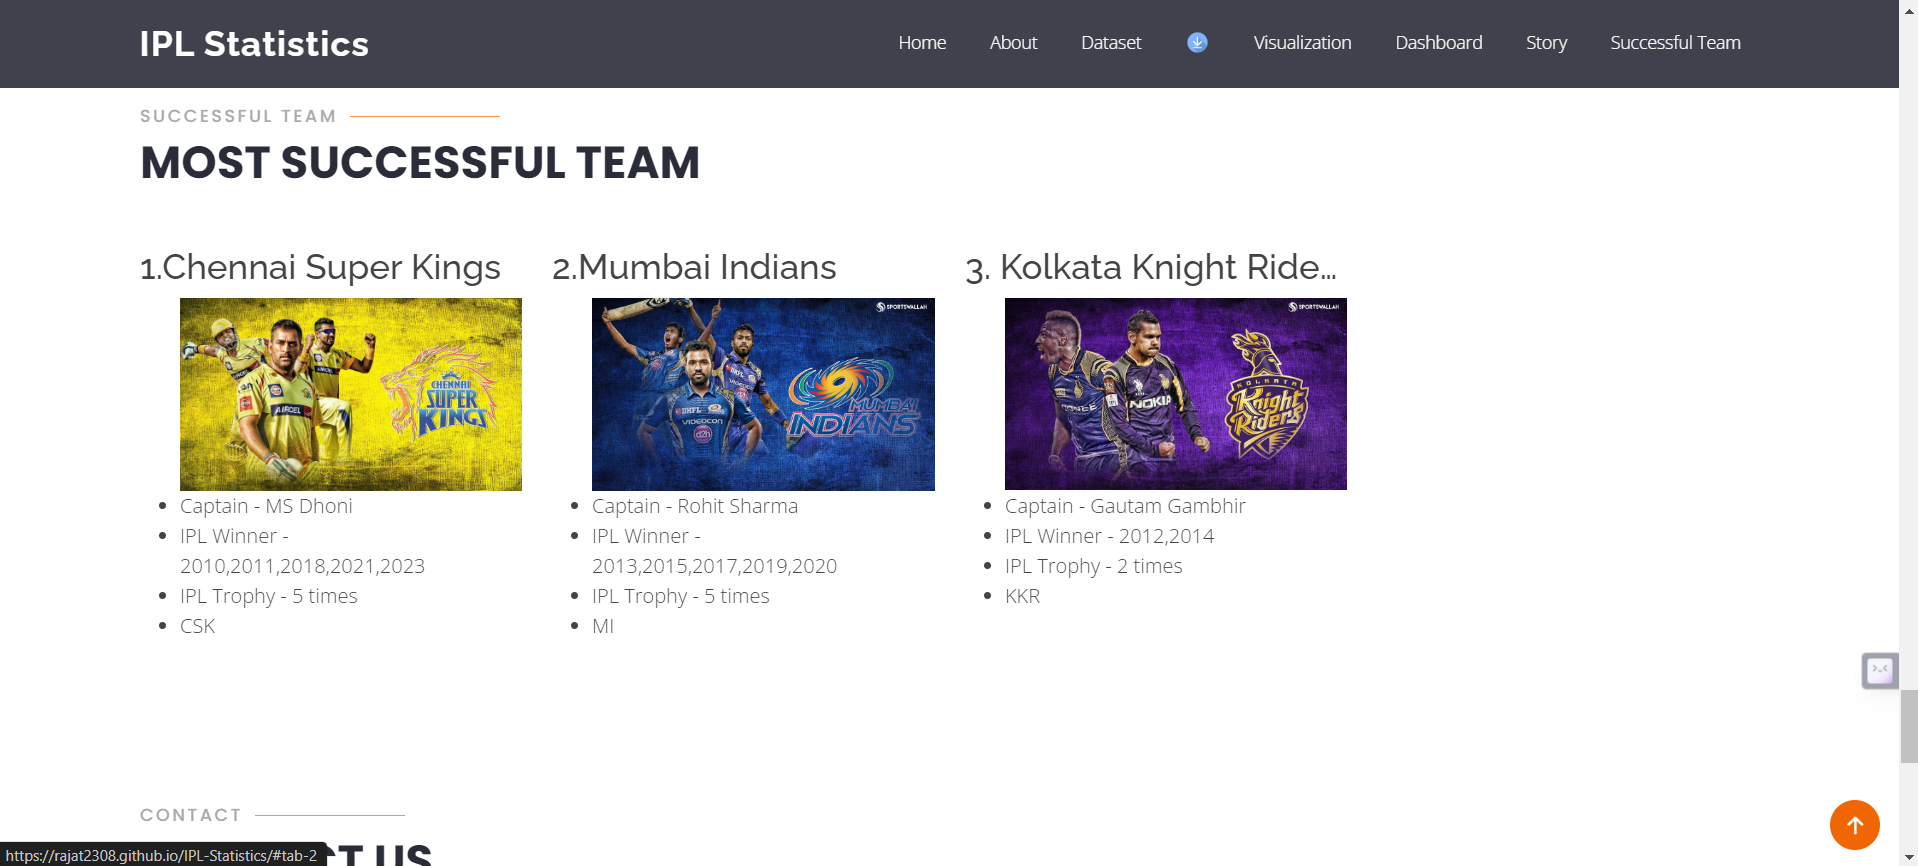
IPL Statistics
Leveraged Tableau to analyse IPL statistics, including total 4s, 6s, orange and purple cap winners, winning teams, match outcomes based on toss decisions, and winning percentages for choosing to bat or field first by year.